Live Edge Dashboard
Real results. Full transparency. Every trade — wins and losses alike.
Net Return
—
Max Drawdown
—
Months Tracked
—
Last Updated: Loading...
This dashboard is for informational and educational purposes only. Nothing herein constitutes investment advice. All projected returns are based on a $20,000 starting portfolio and are mathematical extrapolations — not guarantees. Past performance is not indicative of future results. Full disclosure ↓
Ekantik Futures Execution
Selective, high-conviction futures trades filtered before market open
E-mini S&P 500 (ES) Futures | $50/point | 1 Contract | Starting: $20,000
Risk: $500/day (2.5%)
daily risk limit
Join Discord Channel
Follow trades in real time
Live Edge — Updated Weekly
Every number below is calculated from — real trades documented in Discord . Watch the edge evolve over time.
Last updated
—
—
—
on $20,000
—
—
—
—
—
S&P 500 E-mini
Individual results will vary. Full disclosure
Portfolio Parameters
Min Portfolio
$20,000
starting capital
Daily Risk
$500
2.5% of portfolio
Instrument
ES
E-mini S&P 500
Contract
1
$50/point
Monthly Returns
Month-by-month performance breakdown
Loading monthly data...
Actual Account Performance
Real realized P&L — trade by trade vs S&P 500
Actual realized P&L. S&P 500 shown as benchmark over same period. No projections.
S&P 500
$20K → —
same date range as trades
Drawdown: calculating...
ECFS PREDISPOSAL
$20K → —
at current risk parameters
vs S&P 500: calculating...
Est. Max DD: calculating...
Projections are mathematical extrapolations based on current edge, not guarantees. Full disclosure
Inception-to-Date Summary
Loading inception data...
How Is The Edge Calculated?
The mathematical formula behind every trading decision
EXPECTED VALUE FORMULA
WIN RATE
—
AVG WIN
—
LOSS RATE × AVG LOSS
—
EDGE PER TRADE
—
EV = (Win% × Avg Win) − (Loss% × Avg Loss)
EV = ...
EV = ...
EV = ...
Upload your weekly Excel report to see your edge analysis — every number below is derived from real trade results.
WIN RATE
—
RISK BUDGET
$500 /day
W/L RATIO
—
Edge Week by Week
Weekly EV per trade (%R) · bars = each week · line = cumulative edge as data grows
What Makes This Structural Edge Powerful?
Edge × frequency = annual returns
The Structural Edge Principle — Convergence Over Volume
A structural edge doesn't require winning every trade. It requires a built-in mathematical advantage applied consistently at volume. Individual outcomes vary — the structure is what drives results over time. Click "Run Simulation" to see how a small per-trade edge converges.
With a validated structural edge, individual trade randomness washes out over volume — the cumulative result converges toward the expected value.
| Strategy | Edge/Trade | Trades/Mo | Annual R extrapolated · all-time | ½ Kelly recommended size |
|---|
Upload data to see your edge position
Magnitude
Your edge per trade is significantly larger than a casino's edge.
Frequency
Edge × trades × 12 months = Annual R
Compounding
With selective, high-conviction trades at 2.5% daily risk, fewer trades compound into outsized returns.
Edge Position vs. Industry
The principle is well-documented across institutional finance
The academic literature identifies a common three-part mechanism behind sustained outperformance: a repeatable structural edge, applied with systematic discipline, sized through defined risk per trade. The edge per trade does not need to be large — what matters is that it is real, consistently applied, and scaled appropriately. The mathematics of compounding do the rest.
Structural Edge + Volume
Thousands of small statistical edges, applied algorithmically with precise position sizing. The power comes from repetition, not from any single trade.
Zuckerman, The Man Who Solved the Market, Penguin 2019
Kelly Criterion Sizing
A mathematical edge, sized via the Kelly Criterion, produces asymmetric returns regardless of market direction. The concept has been validated across decades of academic research.
Thorp, A Man for All Markets, Random House 2017
Systematic Discipline
Model-driven strategies that exploit repeatable statistical mispricings. Sustained alpha comes from process consistency, not market prediction.
Patterson, The Quants, Random House 2010
The metrics tracked here — EV per trade, edge per planned R, and trade frequency — are the same variables documented across institutional finance. Academic research by Cliff Asness (AQR Capital) further confirms that systematic edges in momentum and value persist across asset classes and market cycles. Scale comes later. The edge must be validated first.
Returns Multiplier — A Function of Risk
Same edge, different returns — you choose the risk level
Based on your validated edge, returns multiply with risk taken:
The Math: Return = Edge × Risk Per Trade × # of Trades
What "— R" Means
R = the fixed dollar amount risked per trade
For 2.5% daily risk on $20K account, R = $500/day
— R × $500 = —/year at 2.5% daily risk
Returns grow proportionally with risk taken if the edge is truly validated.
Equity Curve
Weekly P&L Trend
P&L Distribution
Daily P&L
Trade Log
| Date/Time | Trade# | B/S | Entry | Stop | Trail | Net Pts | Risk(Pts) | Net$ | Result |
|---|
Individual results will vary. Full disclosure
Paste Discord alerts on the left to preview parsed trades
Upload Weekly Excel Report
10-column format: Date, Trade#, B/S, Entry, Stop, Trail, Net Pts, Risk, Net$, Win/Lose
What Does Buy-and-Hold SPY Really Look Like?
How many profit units do you earn for every pain unit you must tolerate?
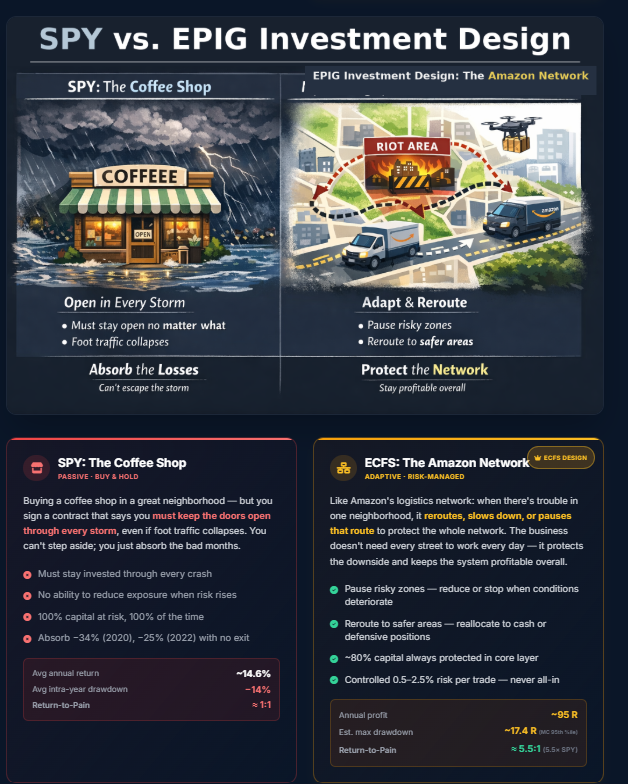
SPY Buy & Hold
~14% ↑
avg annual return
~14% ↓
avg annual pain
≈ 1:1
1 unit gain per 1 unit pain
ECFS Income Sleeve
~95R ↑
annual profit (R units)
~17R ↓
est. max drawdown (MC 95th %ile)
≈ 5.6:1
5.6 units gain per 1 unit pain
SPY: 15-year avg total return with dividends (2011–2025). ECFS drawdown: Monte Carlo simulation (5,000 runs, 95th percentile). Updated weekly.
Where This Edge Fits: The Bigger Picture
The performance you see above is the Tactical Income sleeve of a larger, institutional-grade portfolio architecture. It's not the entire strategy — it's the engine that generates outsized returns while ~80% of capital stays protected.
What you're looking at: Layer B — Tactical Income
Ekantik Futures is a Tactical execution strategy within a complete portfolio framework called EPIG (Enduring Principal Protection · Income & Growth). They represent 5-10% of total capital allocation — designed to harvest volatility and generate income through high-EV, risk-managed futures trading.
How EPIG Works: Three-Layer Architecture
Expected Value × Volume × Risk Management
Core
Capital Preservation Baseline
Purpose: Protect principal — SPY/cash in normal markets, Mag 7 names only at meaningful correction levels
~80%
Tactical
High-EV Window Harvesting
Purpose: Harvest volatility & generate outsized returns
5-10%
← Ekantik Futures
Episodic Pivot
Strategic Growth Plays
Purpose: Capitalize on transformative catalysts
5-10%
Typical Portfolio Allocation
Barbell structure: massive capital protection + concentrated tactical edge
Key Insight: ~80% of capital is always protected. The 5-10% tactical overlay plus 5-10% episodic pivots allocation generates outsized returns through leverage, selectivity, and strategic catalysts — totaling 100% deployed capital.
EPIG — Enduring Principal Protection · Income & Growth
The complete three-layer portfolio architecture is available exclusively to founding members. The dashboard above demonstrates the Tactical Income engine (Layer B) — the systematic edge that drives returns while the barbell structure keeps your principal protected.
Past performance is not indicative of future results. Portfolio allocation examples are illustrative. Full disclosure